Back to Blog

Keyfleet Updates
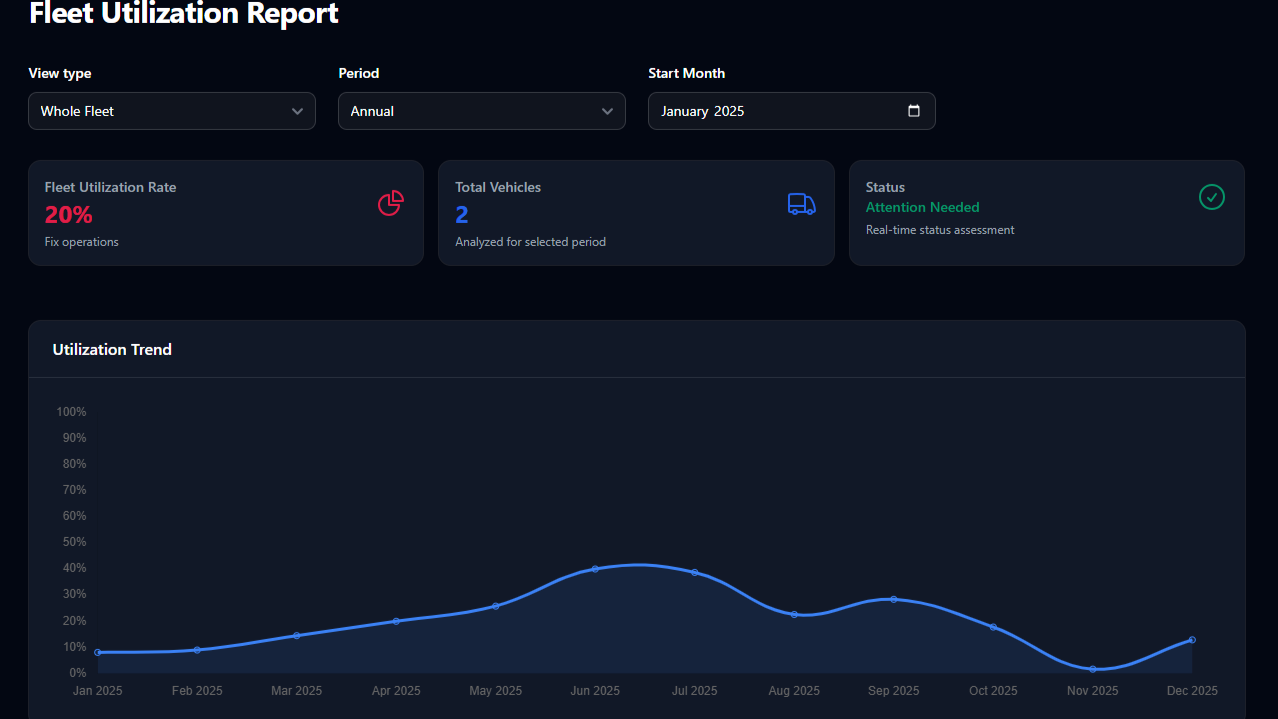
Fleet Utilization Report
Rhay Ras
March 08, 2026
4 months ago
This section of the blog (or user manual) explains how KeyFleet uses data to manage your experience. By categorizing every vehicle's performance, we ensure you always get the best car at the best price.
How to Read Our Fleet Performance
Every vehicle in our system is monitored in real-time. We use a specific Performance Rating system to manage our inventory and ensure reliability for your bookings.
The 4 Performance Zones
- ⭐ Excellent (90% – 100%)
- Status: Primary (Blue/Purple)
- Recommendation: Ready to add vehicles.
- What it means: These are our top-performing cars. When a model hits this range, it’s a signal for us to expand the fleet so we can keep up with your high demand.
- ✅ Good (70% – 89%)
- Status: Info (Blue)
- Recommendation: Optimize pricing.
- What it means: Healthy, steady operations. This is the "sweet spot" where our cars are well-utilized and performing perfectly for our clients.
- ⚠️ Moderate (50% – 69%)
- Status: Warning (Amber)
- Recommendation: Improve demand.
- What it means: These cars are available and ready for the road. We use this data to create better visibility or special offers to get these "hidden gems" in front of more drivers.
- 🚨 Poor (Below 50%)
- Status: Danger (Red)
- Recommendation: Fix operations.
- What it means: This vehicle is under-performing. Our team immediately investigates to see if it needs a maintenance check, a price adjustment, or a change in strategy to ensure it’s serving our clients effectively.
Navigating the Dashboard: Your Filter Guide
To get the most accurate data for your planning, you can use our built-in filters to narrow down the fleet metrics.
1. View Type
- Whole Fleet: See the "Big Picture." This gives you the average performance of every car we own.
- Per Car: Deep dive into a specific vehicle. Perfect if you want to see the track record of a specific SUV or Sedan before you commit to a long-term rental.
2. Reporting Period
- Monthly: Track immediate trends. Best for seeing what’s popular right now this season.
- Semi-Annual: View a 6-month performance window. Great for identifying long-term reliability.
- Annual: The full 12-month history. This helps us plan for yearly peak seasons (like holidays) to ensure we have enough cars ready for everyone.
3. Date & Vehicle Selection
- Select Month: You can jump back to any previous month to see past performance or look at the current month's "Start" metrics.
- Vehicle Search: When using the "Per Car" view, you can quickly search for a specific plate number or model name to pull up its individual utilization chart.
By using these tools, KeyFleet stays ahead of the curve—meaning you spend less time worrying about availability and more time on the road.
Tags:
#keyfleet updates
#keyfleet
#fleet utilization report
#report